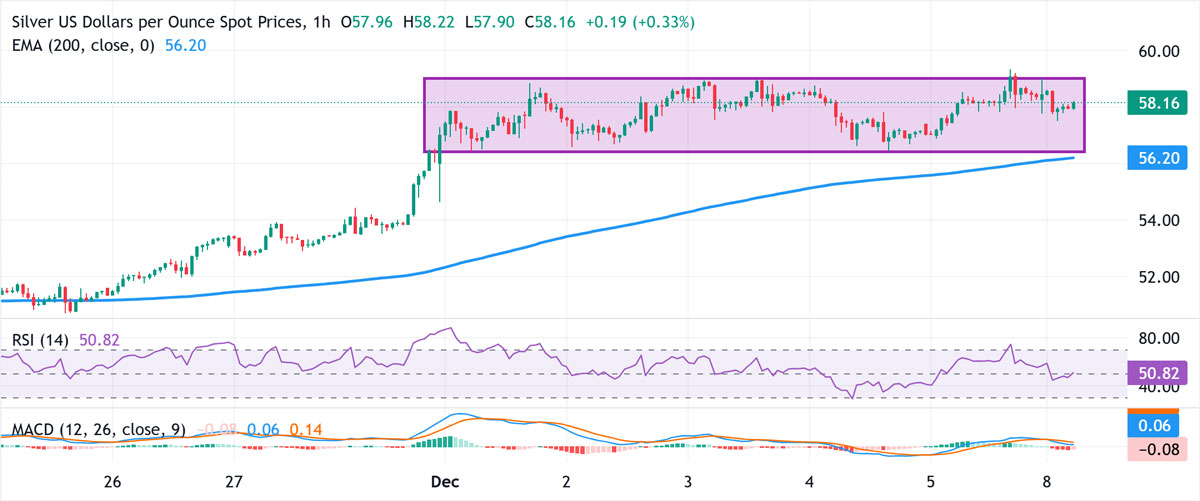
Silver (XAG/USD) traded without a clear intraday direction on Monday, fluctuating between mild gains and modest losses through the Asian session. The metal hovered near $58.20, down roughly 0.30% on the day, though the overall technical backdrop continues to favor buyers.
XAG/USD holds in bullish consolidation phase
Since the start of the month, XAG/USD has been moving within a broader sideways range. Considering the sharp rally that recently drove prices to an all-time high, the ongoing pause appears to be a classic bullish consolidation pattern. While the structure supports upside continuation, mixed short-term oscillators suggest some caution in the near term.
Technical indicators support a constructive bias
The pair remains comfortably above the rising 200-hour Exponential Moving Average (EMA) at $56.30, reinforcing the broader bullish tone. The Moving Average Convergence Divergence (MACD) has slipped below the zero line, signaling weakening upside momentum, while the Relative Strength Index (RSI) sits at a neutral 50.82, indicating consolidation rather than trend exhaustion.
The upward-sloping 200-hour EMA suggests the underlying trend remains intact as long as XAG/USD holds above it. A defense of the $56.20–$56.30 region should keep downside attempts limited. A daily close above $59.00 would strengthen bullish momentum and open the door for a retest of $59.35 – the all-time high.
Key levels to watch
Immediate support sits at the daily low near $57.50. A decisive move below this level could expose the $57.00 handle, followed by range support around $56.45. A break beneath the 200-hour EMA would mark a notable shift in near-term bias, potentially favoring bearish traders.
Silver 1-hour chart