The EUR/USD pair drifts lower toward the 1.1730 area during early European trading on Wednesday, weighed down by renewed demand for the US Dollar (USD). However, downside pressure on the pair appears contained as markets increasingly price in the view that the European Central Bank (ECB) has reached the end of its rate-cutting cycle. The ECB is widely expected to keep interest rates unchanged at its December meeting on Thursday, maintaining the key deposit rate at 2%, where it has stood since July.
On the US front, November’s employment data painted a mixed picture of the labor market, signaling ongoing resilience alongside emerging signs of cooling. This combination could limit further USD gains and provide some support for EUR/USD. US Nonfarm Payrolls (NFP) increased by 64,000 in November, rebounding from a revised decline of 105,000 in October and beating market expectations of a 50,000 increase. At the same time, the US Unemployment Rate edged up to 4.6% from 4.4%, underscoring a gradual softening in labor market conditions.
EUR/USD chart analysis
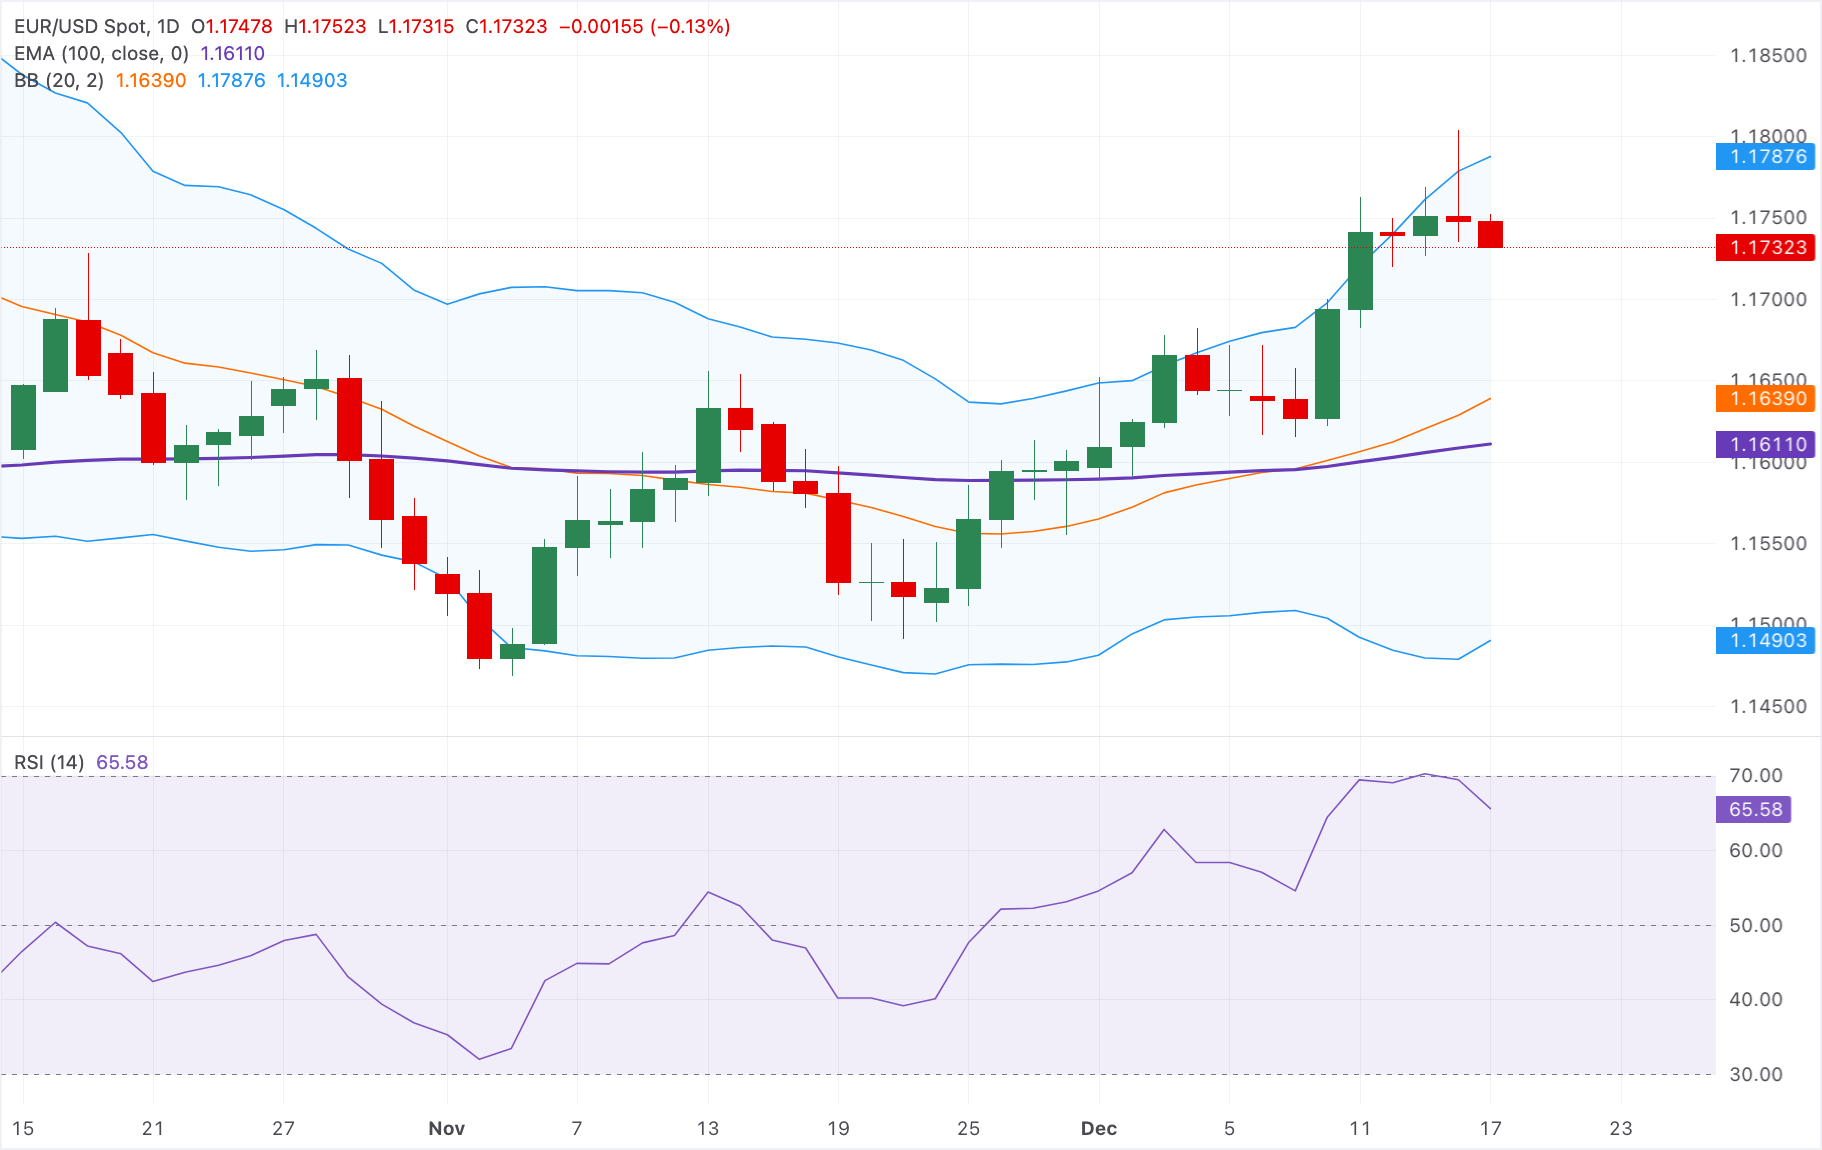
On the daily chart, EUR/USD is trading around 1.1732, holding comfortably above the 100-day exponential moving average (EMA), which is rising near 1.1611 and reinforcing the broader bullish structure. The 20-day moving average within the Bollinger Bands is climbing toward 1.1639, suggesting that any pullbacks remain shallow and well supported.
Price action is skewed toward the upper Bollinger Band, while the bands themselves are widening, a signal of strengthening bullish momentum combined with rising volatility. The Relative Strength Index (RSI) stands at 65.58, indicating solid upside momentum without entering overbought territory.
Immediate resistance is located at the upper Bollinger Band near 1.1788. On the downside, initial support is seen at the mid-band around 1.1639, followed by the 100-day EMA at 1.1611. A sustained break above resistance could pave the way for a further extension of gains, while a failure to do so may trigger a corrective pullback toward key support levels.
Ready to start trading Forex? Join iXBroker today and kick-start your trading journey now!