Solana price has come under heavy pressure over the past few months, shedding nearly half of its value from the August peak. The broader crypto market downturn has weighed on both price action and on-chain activity, raising concerns about further downside risks.
At the time of writing, the Solana token is trading near $124.50, down sharply from its August high. Technical signals on the daily chart suggest that SOL could remain vulnerable, while several key network metrics have deteriorated in recent weeks.
![]()
On-chain activity shows broad slowdown
Data from Nansen shows that the number of transactions on the Solana network declined by 10% over the past 30 days to 1.79 billion. Despite this pullback, Solana remains the most active blockchain in the crypto industry, processing more transactions than the next five networks combined.
The number of active addresses fell by 5.7% over the same period to 60.1 million. More notably, network fees dropped by 21% to around $14 million, signaling reduced user engagement and lower economic activity.
Additional metrics reinforce the slowdown. Total value locked on Solana has declined to $18.57 billion, down significantly from the year-to-date high of $30 billion. On a positive note, TVL measured in SOL terms has continued to rise, partially offsetting the decline in USD value.
While the supply of stablecoins on Solana increased by 15% over the past 30 days, other indicators paint a weaker picture. Adjusted transaction volume fell by 30% to $238 billion, and the number of holders dropped by 9% to 3.4 million.
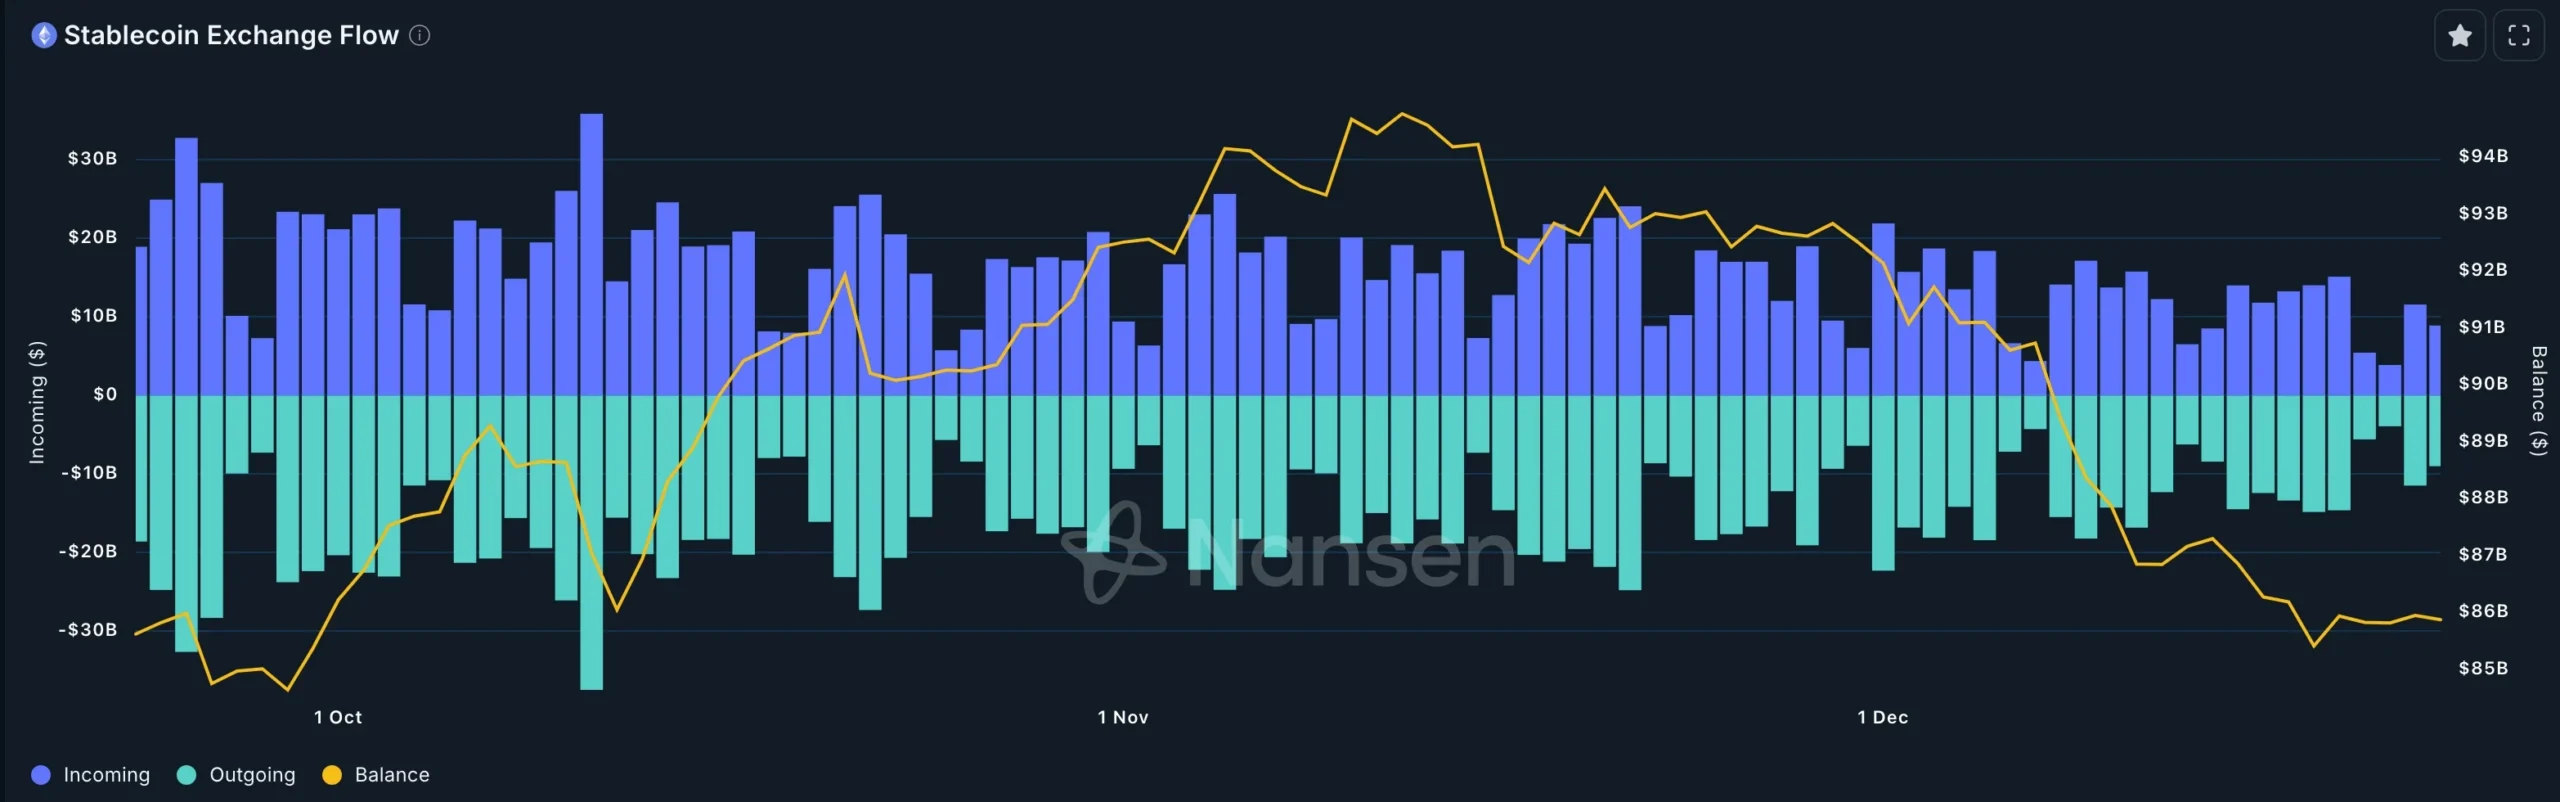
This contraction in activity appears closely linked to the broader crypto market correction, which has pushed some participants out of the market. Nansen data shows that stablecoin outflows from exchanges have declined from $94 billion in November to around $85 billion, reflecting reduced capital movement across the sector.
Solana price technical point to more downside
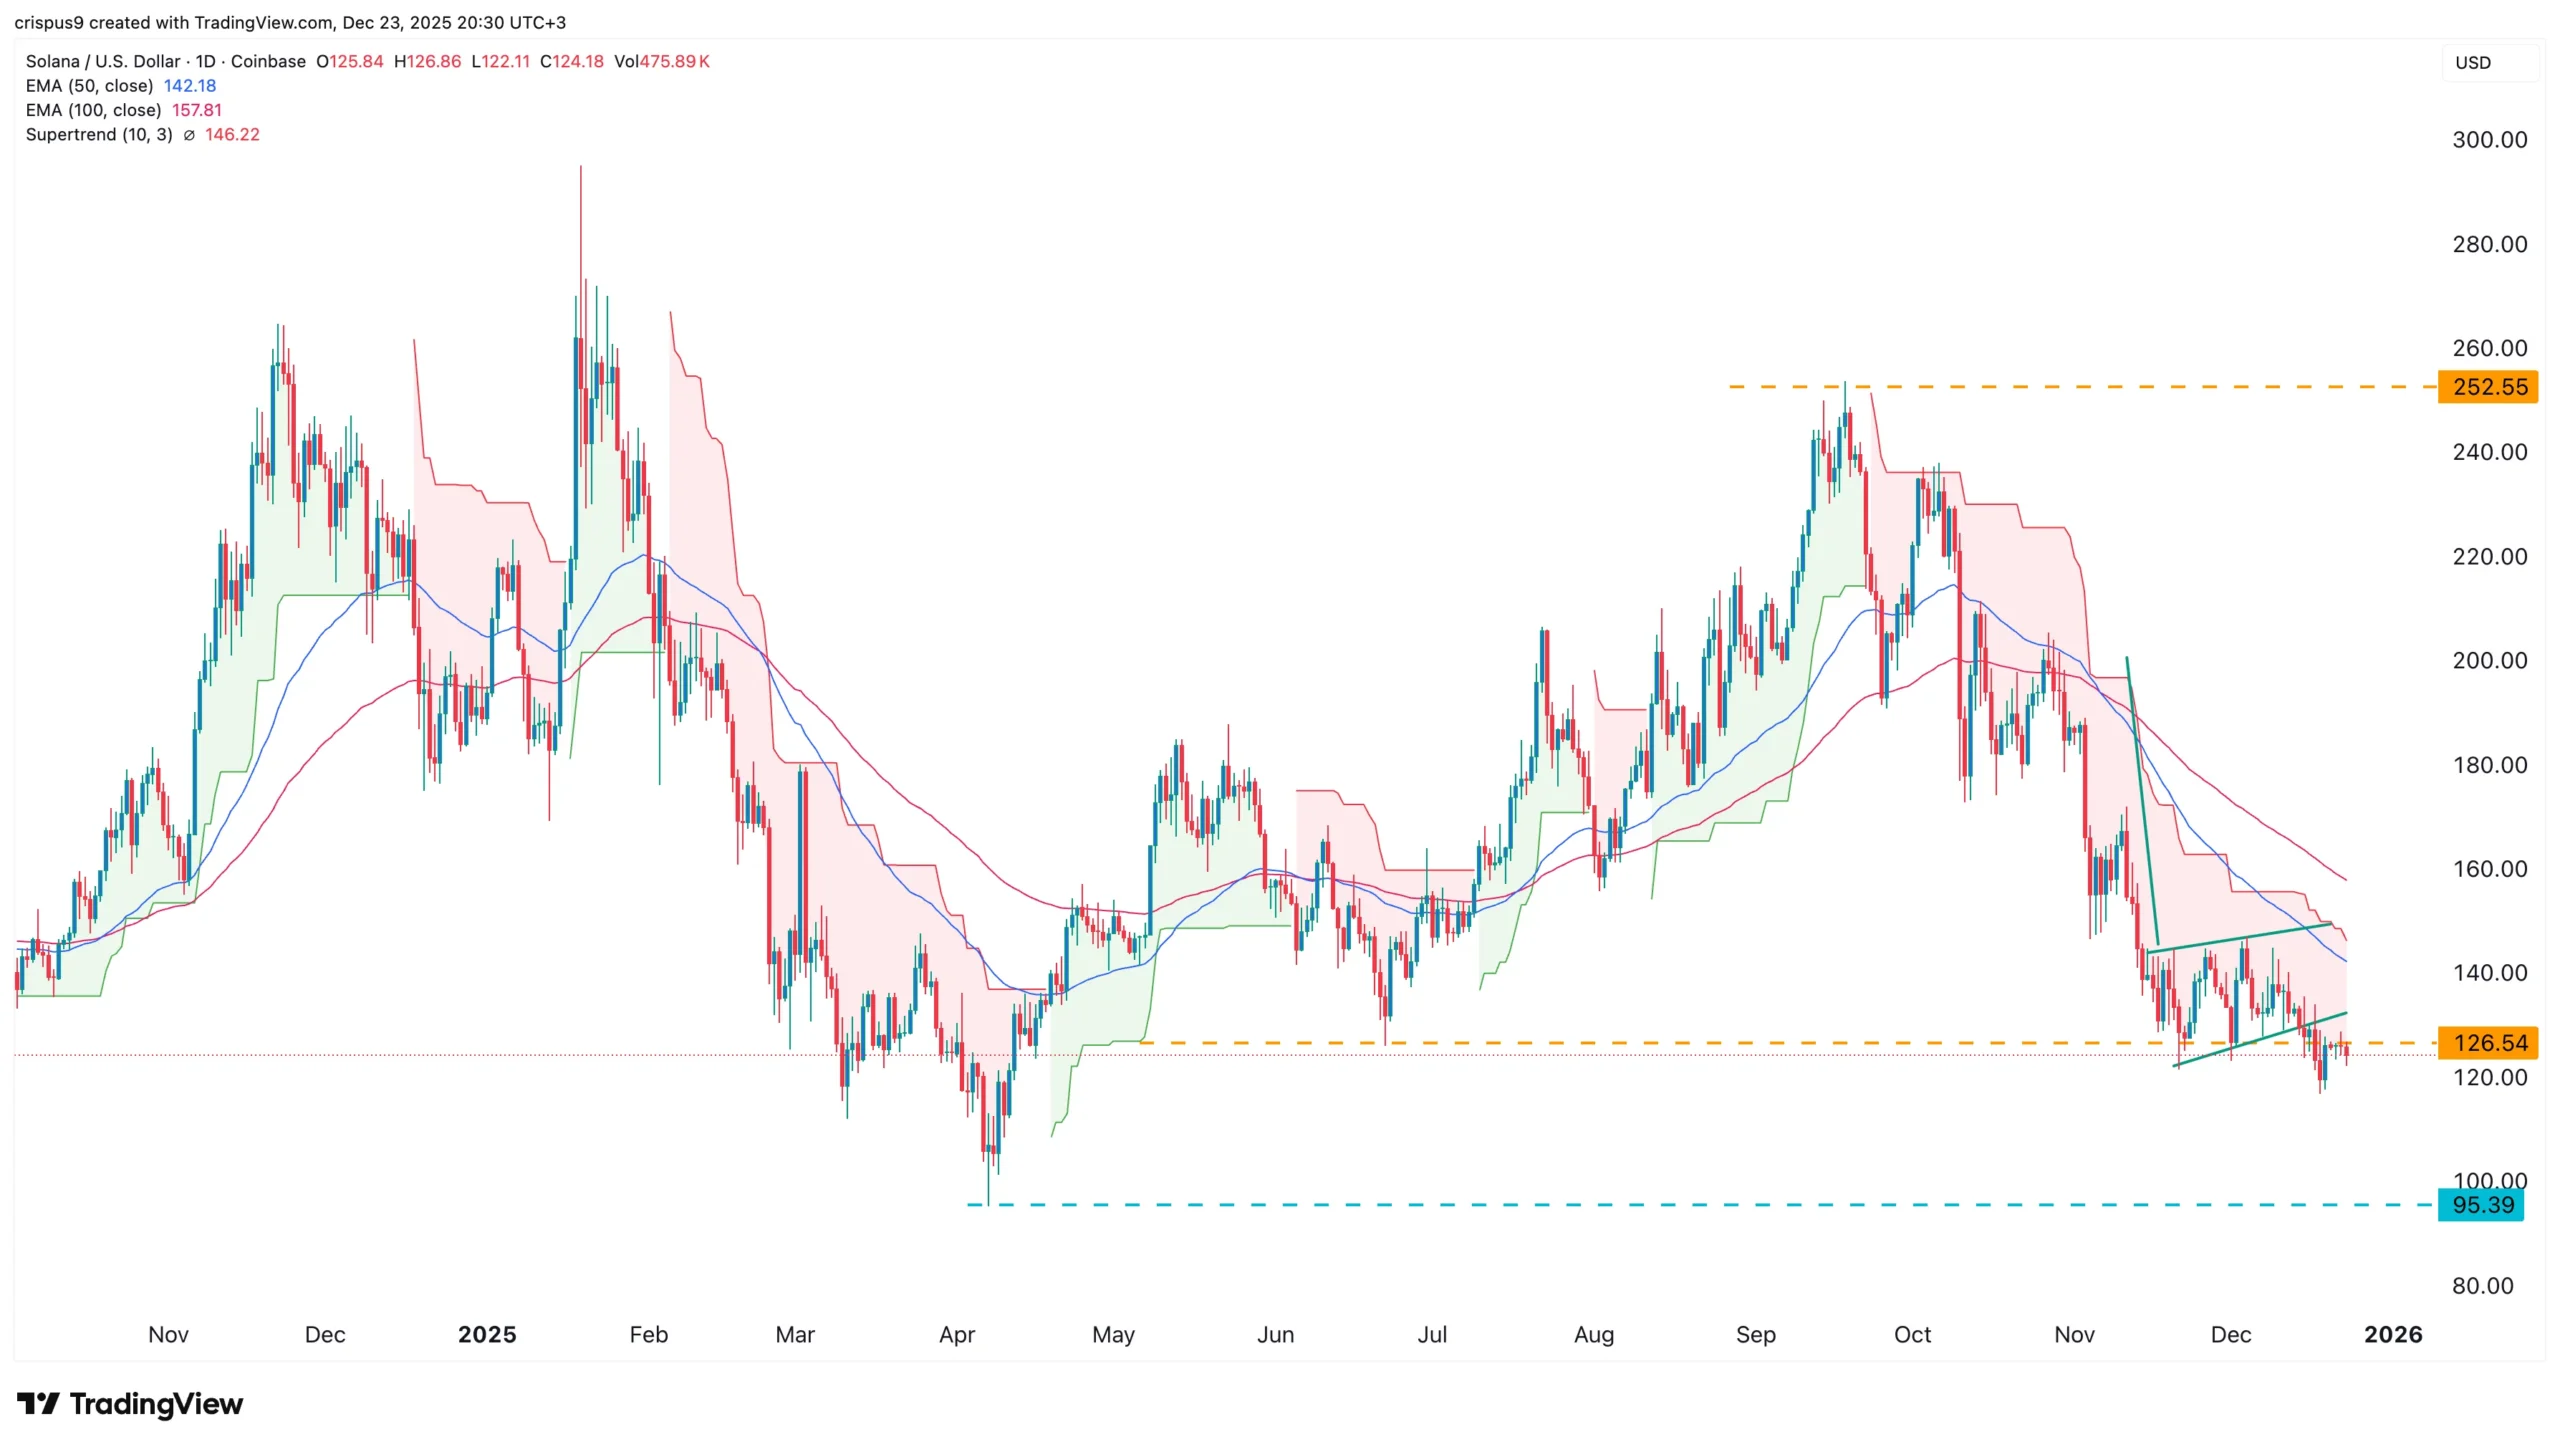
On the daily chart, SOL has fallen from its August high of $252.55 to around $124.30 and continues to trade below all major moving averages, highlighting persistent bearish momentum.
Solana has also formed a bearish flag pattern, a well-known continuation structure that often precedes further declines. The price has broken below the lower boundary of this formation, confirming a bearish breakout.
As a result, downside risks remain elevated, with sellers likely targeting the psychological $100 level. A move toward this zone would imply an additional decline of roughly 20% from current prices, keeping the near-term outlook firmly under pressure unless market conditions improve.
Ready to start trading Forex? Join iXBroker today and kick-start your trading journey now!