In an era where headlines are dominated by the advance of wind farms, solar panels, and batteries, natural gas continues to stand as the backbone of global energy supply. Frequently overlooked amid the surge of “green news,” its irreplaceable contribution is once again underscored by the newly released 2025 Statistical Review of World Energy. Despite mounting global pressures to decarbonize, natural gas remains essential—heating homes, driving manufacturing, powering plants, and connecting continents through a rapidly evolving liquefied natural gas (LNG) market.
Production Powerhouses: America’s Game-Changing Shale Advantage
The story of natural gas in 2024 is one of record-breaking numbers. Global production soared to 398 billion cubic feet per day (Bcf/d), and the United States remains the uncontested world leader, producing just under 100 Bcf/d. Though slightly down from 2023’s peak, the U.S. output dwarfs Canada—its closest North American competitor—by more than fivefold. This ascendancy is rooted in the shale gas revolution, which over two decades has not only made America energy self-sufficient but also a pivotal force in global LNG exports.
Russia, still the world’s second-largest producer at 60.8 Bcf/d, continues to struggle with sanctions, shrinking European markets, and delayed pipeline projects. Its attempts to pivot towards Asia meet hurdles both logistical and geopolitical, leaving it trailing in the global race.
Other major producers shape the geographic diversity of the global natural gas landscape:
- Iran and Qatar: Upwards of 25 and 17 Bcf/d, anchoring the Middle East as an energy fulcrum.
- China: With output now at 23 Bcf/d, the country has doubled production in a decade, aligning with ambitious decarbonization strategies.
- Australia: Clocking in at 14 Bcf/d, it boasts a strategic LNG sector but faces plateau risks due to regulatory headwinds and aging fields.
- Africa: Algeria leads modestly at 9.1 Bcf/d, ahead of Egypt and Nigeria; yet, the continent’s true potential remains untapped due to chronic underinvestment and infrastructure gaps.
A vital trend emerges here: more than half of all natural gas growth over the last decade has come from the OECD despite a dramatic decline in EU output. Even as renewables expand, flexibility and reliability keep natural gas indispensable to modern economies.
Consumption Trends: Asia’s Rising Appetite
2024 marked an all-time high in global natural gas consumption, mirroring production at 398 Bcf/d. The U.S. consumes the lion’s share (87 Bcf/d, 22% of global demand), followed by Russia (46 Bcf/d) and China (42 Bcf/d). The latter’s appetite reflects a determined shift from coal to cleaner energy, a decisive move in its anti-pollution campaign.
Additional key consumers include:
- Iran (24 Bcf/d): Predominantly domestic use.
- Canada, Saudi Arabia (12 Bcf/d each): Power generation and petrochemicals.
- Japan, Germany (9 Bcf/d each): Demand declining slightly as efficiency and renewables gain ground.
- India (6.8 Bcf/d): Gradual growth, especially in fertilizers and power.
Critically, the Asia-Pacific region now nearly matches North America in total consumption, collectively accounting for over 23% of global demand. The past decade’s demand surge (74% of growth, equaling 70 Bcf/d) has shifted almost entirely toward non-OECD nations—a fundamental change from the early 2000s, inverting historical patterns.
Africa, too, is increasingly relevant. Algeria, Egypt, and Nigeria are stepping up, leveraging natural gas to improve energy access and drive local development.
LNG: The Market Game-Changer
In the last ten years, the rise of LNG has redefined global gas dynamics. LNG exports reached 53 Bcf/d in 2024—triple what they were in 2010. The United States leads this export boom (11 Bcf/d), transforming from net importer to vital supplier, especially to Europe as it seeks to re-balance supply chains post-Russian sanctions.
Qatar, investing in future capacity, and Australia, though facing mature field declines, are close runners-up. Russia’s exports (4.3 Bcf/d) remain hampered by sanctions. African nations like Nigeria and Algeria contribute a combined 4.9 Bcf/d. New entrants like Papua New Guinea are reshaping the competitive map.
This diversification—now spanning five continents—has resulted in a more flexible, liquid, and resilient gas market. Producers and consumers alike benefit from the increased security of supply and price transparency.
iXDeep: Financial Market Impact – From Forex to Crypto
Natural Gas’s Resilience and LNG Expansion: A Driver of Market Volatility
As natural gas cements its strategic role, the financial markets—from Forex to crypto—are feeling the tremors:
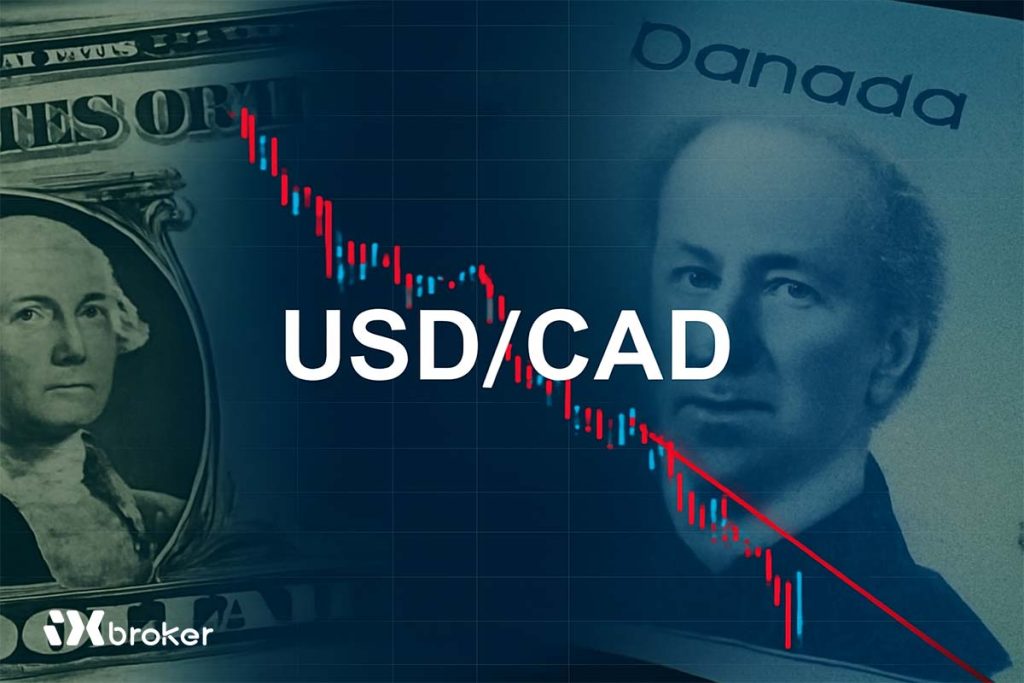
- Forex Markets: The robust U.S. position in production and LNG exports reinforces the dollar’s dominance in global energy trade. Currency pairs tied to resource exporters (USD/CAD, AUD/USD, NOK/USD) are likely to see renewed volatility as global supply chain shifts realign cash flows.
- Commodities Trading: Natural gas futures remain a preferred volatility instrument, serving as hedges for both utility-facing investments and speculative trades. Shocks in LNG pricing, infrastructure, or new sanctions could ripple rapidly into oil, petrochemical, and even agricultural commodities.
- Emerging Markets: Gas-rich countries could attract increased investment, but risks remain tied to infrastructure and governance, particularly in Africa and parts of Asia.
- Crypto Markets: While the direct connection is thin, narratives around “digital energy tokens” and the tokenization of LNG and carbon offsets are growing within DeFi communities. Market participants should watch for intersectional volatility and token listings tied to natural resource indexes.
Moving forward, regulatory developments around carbon capture, hydrogen blending, and methane emissions could alter both physical and financial flows—creating both risk and opportunity for diversified investors.